This blog post shows how to setup Grafana to display Sawtooth and system statistics.
Overview
Grafana is a useful tool for displaying Sawtooth performance statistics. Hyperledger Sawtooth optionally generates performance metrics from the validator and REST API components for a each node. Sawtooth sends the metrics to InfluxDB, a time series database that is optimized for fast access to time series data. Telegraf, a metrics reporting agent, gathers supplemental system information from the Linux kernel and also sends it to InfluxDB. Finally, Grafana reads from the InfluxDB and displays an assortment of statistics on several graphical charts in your web browser. Figure 1 illustrates the flow of data.
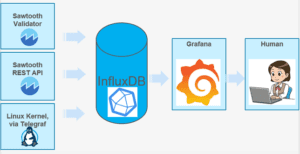
Figure 1. Metrics gathering data flow.
Grafana can display many validator, REST API, and system statistics. The following lists all supported metrics:
Sawtooth Validator Metrics
- Block number
- Committed transactions
- Blocks published
- Blocks considered
- Chain head moved to fork
- Pending batches—number of batches waiting to be processed
- Batches rejected (back-pressure)—number of rejected batches due to back-pressure tests
- Transaction execution rate, in batches per second
- Transactions in process
- Transaction processing duration (99th percentile), in milliseconds
- Valid transaction response rate
- Invalid transaction response rate
- Internal error response rate
- Message round trip times, by message type (95th percentile), in seconds
- Messages sent, per second, by message type
- Message received, per second, by message type
Sawtooth REST API Metrics
- REST API validator response time (75th percentile), in seconds
- REST API batch submission rate, in batches per second
System Metrics
- User and system host CPU usage
- Disk I/O, in kilobytes per second
- I/O wait percentage
- RAM usage, in megabytes
- Context switches
- Read and write I/O ops
- Thread pool task run time and task queue times
- Executing thread pool workers in use
- Dispatcher server thread queue size
The screenshot in Figure 2 gives you an idea of the metrics that Grafana can show.
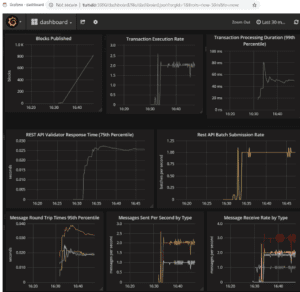
Figure 2. Example Grafana graph display.
Setting Up InfluxDB and Grafana
By default, Hyperledger Sawtooth does not gather performance metrics. The rest of this post explains the steps for enabling this feature. The overall order of steps is listed below with in-depth explanations of each step following.
- Have the required prerequisites: Sawtooth blockchain software is running on Ubuntu and Docker CE software is installed
- Installing and configuring InfluxDB to store performance metrics
- Building and installing Grafana
- Configuring Grafana to display the performance metrics
- Configuring Sawtooth to generate performance metrics
- Installing and configuring Telegraf to collect metrics
1. Prerequisites: Sawtooth and Docker
Install Hyperledger Sawtooth software and Docker containers. I recommend Sawtooth 1.1 on Ubuntu 16 LTS (Xenial). Sawtooth installation instructions are here: https://sawtooth.hyperledger.org/docs/core/releases/latest/app_developers_guide/ubuntu.html
The Sawtooth blockchain software must be up and running before you proceed.
Docker CE installation instructions are here: https://docs.docker.com/install/linux/docker-ce/ubuntu/#install-using-the-repository
| ProTip: These instructions assume a Sawtooth node is running directly on Ubuntu, not in Docker containers. To use Grafana with Sawtooth on Docker containers, additional steps (not described here) are required to allow the Sawtooth validator and REST API containers to communicate with the InfluxDB daemon at TCP port 8086. |
2. Installing and Configuring the InfluxDB Container
InfluxDB stores the Sawtooth metrics used in the analysis and graphing. Listing 1 shows the commands to download the InfluxDB Docker container, create a database directory, start the Docker container, and verify that it is running.
sudo docker pull influxdb
sudo mkdir -p /var/lib/influx-data
sudo docker run -d -p 8086:8086 \
    -v /var/lib/influx-data:/var/lib/influxdb \
    -e INFLUXDB_DB=metrics \
    -e INFLUXDB_HTTP_AUTH_ENABLED=true \
    -e INFLUXDB_ADMIN_USER="admin" \
    -e INFLUXDB_ADMIN_PASSWORD="pwadmin" \
    -e INFLUXDB_USER="lrdata" \
    -e INFLUXDB_USER_PASSWORD="pwlrdata" \
    --name sawtooth-stats-influxdb influxdb
sudo docker ps --filter name=sawtooth-stats-influxdb
Listing 1. Commands to set up InfluxDB.
| ProTip: You can change the sample passwords here, pwadmin and pwlrdata, to anything you like. If you do, you must use your passwords in all the steps below. Avoid or escape special characters in your password such as “,@!$” or you will not be able to connect to InfluxDB. |
3. Building and Installing the Grafana Container
Grafana displays the Sawtooth metrics in a web browser. Listing 2 shows the commands to download the Sawtooth repository, build the Grafana Docker container, download the InfluxDB Docker container, create a database directory, start the Docker container, start the Grafana container, and verify that everything is running.
git clone https://github.com/hyperledger/sawtooth-core
cd sawtooth-core/docker
sudo docker build . -f grafana/sawtooth-stats-grafana \
    -t sawtooth-stats-grafana
sudo docker run -d -p 3000:3000 --name sawtooth-stats-grafana \
    sawtooth-stats-grafana
sudo docker ps --filter name=sawtooth-stats-grafana
Listing 2. Commands to set up Grafana.
Building the Grafana Docker container takes several steps and downloads several packages into the container. It ends with “successfully built” and “successfully tagged” messages.
4. Configuring Grafana
Configure Grafana from your web browser. Navigate to http://localhost:3000/ (replace “localhost” with the hostname or IP address of the system where you started the Grafana container in the previous step).
- Login as user “admin”, password “admin”
- (Optional step) If you wish, change the Grafana webpage “admin” password by clicking the orange spiral icon on the top left, selecting “admin” in the pull-down menu, click on “Profile” and “Change Password”, then enter the old password, (admin) and your new password and, finally, click on “Change Password”. This Grafana password is not related to the InfluxDB passwords used in a previous step.
- Click the orange spiral icon again on the top left, then click on “Data Sources” in the drop-down menu.
- Click on the “metrics” data source.
- Under “URL”, change “influxdb” in the URL to the hostname or IP address where you are running InfluxDB. (Use the same hostname that you used for Grafana web page, since the Grafana and InfluxDB containers run on the same host.) This is where Grafana accesses the InfluxDB
- Under “Access”, change “proxy” to “direct” (unless you are going through a proxy to access the remote host running InfluxDB)
- Under “InfluxDB Details”, set “User” to “lrdata” and “Password” to “pwlrdata”
- Click “Save & Test” to save the configuration in the Grafana container
- If the test succeeds, the green messages “Data source updated” and “Data source is working” will appear. Figure 3 illustrates the green messages. Otherwise, you get a red error message that you must fix before proceeding. An error at this point is usually a network problem, such as a firewall or proxy configuration or a wrong hostname or IP address.
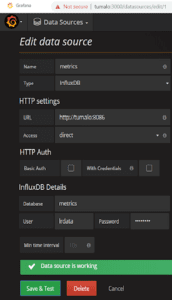
Figure 3. Test success messages in Grafana.
For the older Sawtooth 1.0 release, follow these additional steps to add the Sawtooth 1.0 dashboard to Grafana (skip these steps for Sawtooth 1.1):
- In your terminal, copy the file sawtooth_performance.json from the sawtooth-core repository you cloned earlier to your current directory by issuing the commands in Listing 3.
$ cp \
sawtooth-core/docker/grafana/dashboards/sawtooth_performance.json .
Or download this file:
$ wget \Listing 3. Commands for getting the Sawtooth 1.0 dashboard file.
- In your web browser, click the orange spiral icon again on the top left, select “Dashboards” in the drop-down menu, then click on “Import” and “Upload .json file”.
- Navigate to the directory where you saved sawtooth_performance.json.
- Select “metrics” in the drop-down menu and click on “Import”.
5. Configuring Sawtooth
The Sawtooth validator and REST API components each report their own set of metrics, so you must configure the login credentials and destination for InfluxDB. In your terminal window, run the shell commands in Listing 4 to create or update the Sawtooth configuration files validator.toml and rest_api.toml:
for i in /etc/sawtooth/validator.toml /etc/sawtooth/rest_api.toml
do
    [[ -f $i ]] || sudo -u sawtooth cp $i.example $i
    echo 'opentsdb_url = "http://localhost:8086"' \
       | sudo -u sawtooth tee -a $i
    echo 'opentsdb_db = "metrics"' \

       | sudo -u sawtooth tee -a $i
    echo 'opentsdb_username  = "lrdata"' \

       | sudo -u sawtooth tee -a $i
    echo 'opentsdb_password  = "pwlrdata"' \

       | sudo -u sawtooth tee -a $i
done
Listing 4. Commands to create or update Sawooth configuration.
After verifying that the files validator.toml and rest_api.toml each have the four new opentsdb_* configuration lines, restart the sawtooth-validator and sawtooth-rest-api using the commands in Listing 5
sudo -v
sudo -u sawtooth pkill sawtooth-rest-api
sudo -u sawtooth pkill sawtooth-validator
sudo -u sawtooth sawtooth-validator -vvv &
sudo -u sawtooth sawtooth-rest-api -vv &
Listing 5. Manual restart commands.
Add any command line parameters you may use to the above example.
If you use systemctl, Listing 6 shows the commands needed to restart.:
systemctl restart sawtooth-rest-api
systemctl restart sawtooth-validator
Listing 6. Systemctl restart commands.
| Protip: The InfluxDB daemon, influxd, listens to TCP port 8086, so this port must be accessible over the local network from the validator and REST API components. By default, influxd only listens to localhost. |
6. Installing and Configuring Telegraf
Telegraf, InfluxDB’s metrics reporting agent, gathers metrics information from the Linux kernel to supplement the metrics information sent from Sawtooth. Telegraf needs the login credentials and destination for InfluxDB. Install Telegraf use the commands in Listing 7.
curl -sL https://repos.influxdata.com/influxdb.key \
   | sudo apt-key add -
sudo apt-add-repository \
   "deb https://repos.influxdata.com/ubuntu xenial stable"
sudo apt-get update
sudo apt-get install telegraf
Listing 7. Commands for installing Telegraf.
The commands in Listing 8 set up the Telegraf configuration file correctly.
sudo echo '[[outputs.influxdb]]' \
  >/etc/telegraf/telegraf.d/sawtooth.conf
sudo echo 'urls = ["http://localhost:8086"]' \
  >>/etc/telegraf/telegraf.d/sawtooth.conf
sudo echo 'database = "metrics"' \
  >>/etc/telegraf/telegraf.d/sawtooth.conf
sudo echo 'username = "lrdata"' \
  >>/etc/telegraf/telegraf.d/sawtooth.conf
sudo echo 'password = "pwlrdata"' \
  >>/etc/telegraf/telegraf.d/sawtooth.conf
Listing 8. Create the Telegraf configuration file.
Finally restart telegraf with the command in Listing 9.
sudo systemctl restart telegrafListing 9. Restart Telegraf.
Try it out!
After completing all the previous steps, Sawtooth and system statics should appear in the Grafana dashboard webpage. To see them, click the orange spiral icon on the top left, then click on “Dashboards” in the drop-down menu, then click on “Home” next to the spiral icon, and then click on “dashboard”. This is the dashboard for Grafana.
Generate some transactions so you can see activity on the Grafana dashboard. For example, run the intkey workload generator by issuing the Listing 10 commands in a terminal window to create test transactions at the rate of 1 batch per second.
intkey-tp-python -v &
intkey workload --rate 1 -d 5
Listing 10. Start the workload generator to get some statistics.
I recommend changing the time interval in the dashboard from 24 hours to something like 30 minutes so you can see new statistics. Do that by clicking on the clock icon in the upper right of the dashboard. Then click on the refresh icon, ♻, to update the page. Individual graphs can be enlarged or shrunk by moving the dotted triangle tab in the lower right of each graph.
Troubleshooting Tips
-
- If the Grafana webpage is not accessible, the Grafana container is not running or is not accessible over the network. To verify that it is running and start it:
$ docker ps --filter name-sawtooth-stats-grafana
$ docker start sawtooth-stats-grafana
-
- If the container is running, the docker host may not be accessible on the network
- If no system statistics appear at the bottom of the dashboard, either Telegraf is not configured or the InfluxDB container is not running or is not accessible over the network. To verify that InfluxDB is running and start it:
$ docker ps --filter name-sawtooth-stats-influxdb
$ docker start sawtooth-stats-influxdb
-
- Check that the InfluxDB server, influxd, is reachable from the local network. Use the InfluxDB client (package influxdb-client) or curl or both to test. The InfluxDB client command should show a “Connected to” message and the curl command should show a “204 No Content” message.
$ influx -username lrdata -password pwlrdata -port 8086 \
   -host localhost
$ curl -sl -I localhost:8086/ping
- Check that the interval range (shown next to the clock on the upper right of the dashboard) is low enough (such as 1 hour).
- Check that the validator and REST API .toml files and Telegraf sawtooth.conf files have the opentsdb_* configuration lines. Make sure that the passwords and URLs are correct and that they match each other and the passwords set when you started the InfluxDB container.
- Click the refresh icon, ♻, on the upper right of the dashboard.
Further Information
- Using Grafana to Display Sawtooth Metrics, Hyperledger Sawtooth System Administrator’s Guide
- The Hyperledger Sawtooth website, includes documentation, FAQ, and chat and mailing list links (under “Contact”)
- InfluxDB
- Docker hub information for InfluxDB
- Telegraf
- Grafana