Meet Performance SandBox, a new Hyperledger Lab for testing new research to boost performance of blockchain platforms. This is an open source effort and you’re welcome to get involved by checking out the lab’s repository or by joining the monthly Performance and Scale Working Group calls.
What is Performance SandBox?
A new addition to Hyperledger Labs, the Performance Sandbox is a testing environment for Hyperledger projects performance research usage.
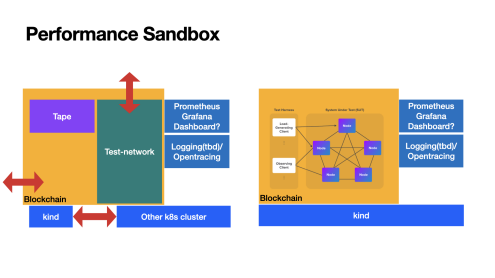
As the picture above shows, the Performance Sandbox uses Kubernetes as its infrastructure and is integrated with monitoring and open tracing (or say open telemetry).
– It supports users deploying a target network such as a test-network, also known as a SUT (system under test), for asset transform for Hyperledger Fabric
– It supports any traffic generator such as Tape, a light-weight tool to test performance of Hyperledger Fabric, that keeps sending traffic to the target network/SUT.
How does the Performance Sandbox work?
Performance researchers are able to use this lab to do research with the steps below:
1. Start the sandbox with Kurbenetes integrated with monitoring and open telemetry
2. Deploy the SUT onto the Kubernetes infrastructure.
3. Start the traffic generator to keep sending traffic to SUT
4. Monitor and analyze test results from the dashboard/open telemetry results.
5. Changes local source code (e.g., Hyperledger Fabric), make local docker image and redeploy the SUT.
It will extend the existing paper published by the PSWG with monitoring and open telemetry. As the right side in the above figure shows, we can see the performance test model published previously by PSWG, with SUT, traffic generator and observers.
Flexible design
– Migration from Kind to other Kubernetes platforms: In this lab, we use Kubernetes as infrastructure, hence it is easy to migrate to any other Kubernetes-based infrastructure.
– Use with blockchain systems other than Hyperledger Fabric: So far, the PoC and demos have been based on Hyperledger Fabric. However, as the orange area shows, the blockchain system can be replaced with any kind of blockchain system.
– Traffic generator: So far this has been deployed as a demo with Tape, as it is a Kubernetes development. It can be replaced with Hyperledger Caliper or Jmeter. Tape is a sample performance tool for Hyperledger Fabric without an SDK (close to the blockchain network itself). Caliper is based on the Hyperledger Fabric SDK (closer to the application level). You may need to use Jmeter to create traffic for end-to-end performance research assuming you expose the RESTFUL endpoint to the end user
– Size of SUT: you are able to scale the size for SUT, as it is a blockchain based on Kubernetes.
Technological details
Read on for technological details around three topics: deploying monitoring tools with operator, traffic generator, and dashboard.
Deploying monitoring tools with operator
In the Performance Sandbox, we used operator technology (refer to operator capablities) to make monitoring systems work with Auto Scaling and Auto Tuning.
For example:
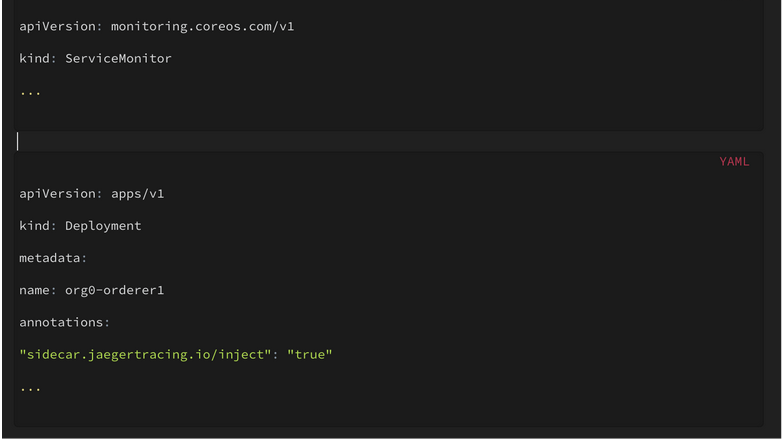
When a blockchain node (e.g., Hyperledger Fabric peer) has been deployed, the Kubernetes operator will help make a connection between the blockchain node (as service/pod) and monitoring system (as Prometheus, Jaeger, etc.) to automatically tune the operator framework to a certain workload pattern.
Ideally, users are able to deploy any size of nodes (e.g., number of peers) for the SUT without spending too much effort on configuration.
Meanwhile, the operator is able to deploy across Kubernetes clusters, making it easy to migrate to any specific cluster.
Traffic generator
In most cases, performance is evaluated by TPS (transactions per second). However, there are different scenarios for the “transaction.”
Let’s assume we have an application server that receives a restful API to support Alice and Bob, sending traffic from the application GUI/mobile app. Normally, the application will connect with the blockchain network. Generally speaking, the application depends on the SDK and SDK relay on network protocols such as GRPC.
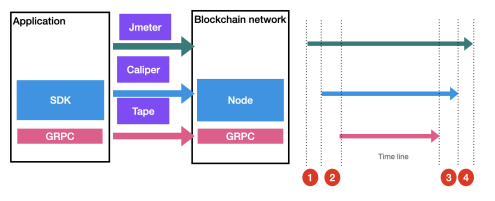
On the left side of the figure above, the three arrows indicate three different levels of traffic.
– At the end user level, indicated by the green arrows, an application receives a business transaction and returns it. Total time spent includes application logic and SDK level duration.
– At the SDK level, indicated by the blue arrows, an SDK receives a business transaction and returns it. Total time spent includes SDK logic and communication level duration.
– At the communication level, indicated by the red arrows, the total time involves packaging business transactions following communication protocol and sending them to the blockchain network.
Hence, we can see from the open tracing span, the green line means the total time starts when the application received the user’s request and ends with application return. Then the blue line appears as SDK processing time. Then the gRPC time reflects the duration for a gRPC to send and receive a response back from the blockchain network.
Ideally, those TPS are nearly the same and you either focus on the application side or blockchain side. However, we’d better have tools on hand for handling some edge cases such as SDK overhead, bad application logic, etc. As on right side:
1. Indicates application processing time before transaction reach at SDK and ready for send to blockchain network.
2. Indicates SDK starts processing the transaction and time spent before network communication happens.
3. Indicates SDK received a result for network communication, and time spent before SDK return.
4. Indicates application processing time before transaction return back to end users from SDK result.
{Note: If you’re interested in blockchain performance testing tools, you can also check out Hyperledger Caliper.}
Dashboard
In the Performance Sandbox, we used a dashboard for system monitoring. In most cases, we analyze TPS as a collection for data drawn as a histogram.
For example, we are able to draw down Transaction Throughput based on timeline into a figure (refer to performance metric). However, as the blockchain is based on crypto service, which relays CPU resources and consensus, that relays bandwidth.
With the dashboard, we are able to collect both blockchain matrix and system matrix at the same time, by integrating different matrices together, identifying limitations/bottlenecks in a visual way.
Assuming bandwidth is a bottleneck for the current Performance Sandbox environment, we can see the CPU/time left with some capabilities at all rounds of testing. Each time when the transaction throughput reaches a specific value, network bandwidth will be used up.
What’s Next
Now, let’s go back to the goal of this new Hyperledger Lab: to provide a sandbox to make performance research usage easier. To see what’s next:
| Blockchain | Deployment | Communication Level Traffic | SDK Level Traffic | User Level Traffic | Dashboard Metrics |
| Hyperledger Fabric | test-network-k8s (WIP, as application and couchdb) | Tape | Hyperledger Caliper (tbd) | jmeter (tbd) | to be completed |
| Hyperledger Fabric | Minifab (tbd) | … | … | … | … |
| Hyperledger Fabric | Hyperledger Bevel (tbd) | … | … | … | … |
| Hyperledger Fabric | Hyperledger Cello (tbd) | … | … | … | … |
Taking Hyperledger Fabric as a sample: we need to support different ways to deploy Hyperledger Fabric as a test network, including Kubernetes, Minifab, Hyperledger Bevel, Hyperledger Cello, etc.
Meanwhile, to fully support traffic generators, we need to go through different levels of traffic generators and complete a dashboard.
Want to get involved?
Here are some places to connect with the code and the community:
- Code repo: https://github.com/hyperledger-labs/PerformanceSandBox
- Monthly meeting: https://wiki.hyperledger.org/display/PSWG/